Profiling Plan
For presentations, community items and keeping our renderer high performance we require to profile our work regularly. Before creating a pull request please compare performance with the master branch.
Setting up the renderer for profiling
- Switch to Release mode.
- Disable the debug layer. (
d3d12_settings.hpp) - Disable the debug factory. (
d3d12_settings.hpp) - Make sure the other settings (
d3d12_settings.hppandsettings.hpp) are the same across the 2 branches you are comparing. - Make sure the settings of
rt_global.hlslmatch across the branches. - When profiling in-engine (which is less accurate) don’t run the application attached to the debugger.
Scenes
When meassuring for a presentation you want to pick a scene that is most interesting for the feature you are meassuring.
However when meassuring for pull requests we want to have a standardized benchmark scene. We will introduce such scene soon. Currently benchmarking Viknell with a camera position of {0, 0, -1.5} will suffice. (The camera position ensures no primary rays are missed)
Numbers
Frame time can introduce a large error margin. To reduce this don’t meassure the frame time but meassure the passess your code has affected instead. For example in NSight:
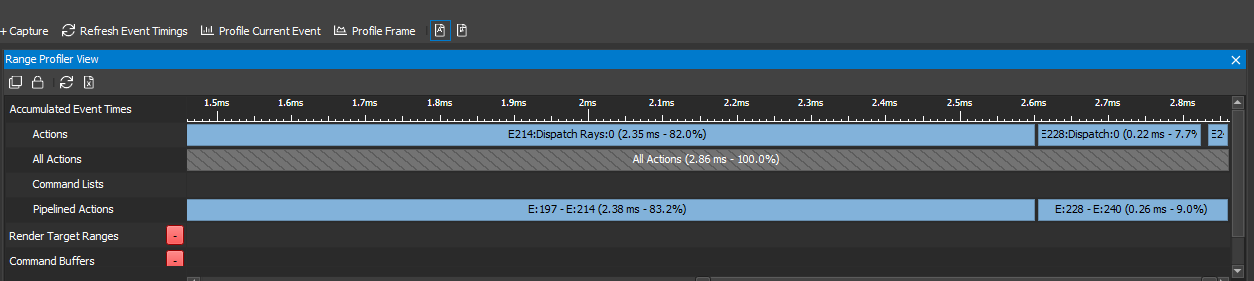
In the range profiler view you can very easily see that the ray tracing in this case DispatchRays takes 2.35 ms and compositing (the Dispatch call) 0.22 ms.
Build-in profiler
The build in editor can be used to look for massive differences in performance and often is good enough for testing a pull request. However it does not suffice for meassurements for presentations. The error margin is far to high.
Tools
GPU Profilers
- Render Doc
- NVIDIA Nsight
- Visual Studio Profiler & Debugger
CPU Profilers
- VTune
- Visual Studio Profiler
Memory Profilers
- Visual Studio Profiler
- Valgrind
- Dr.Memory